
In short
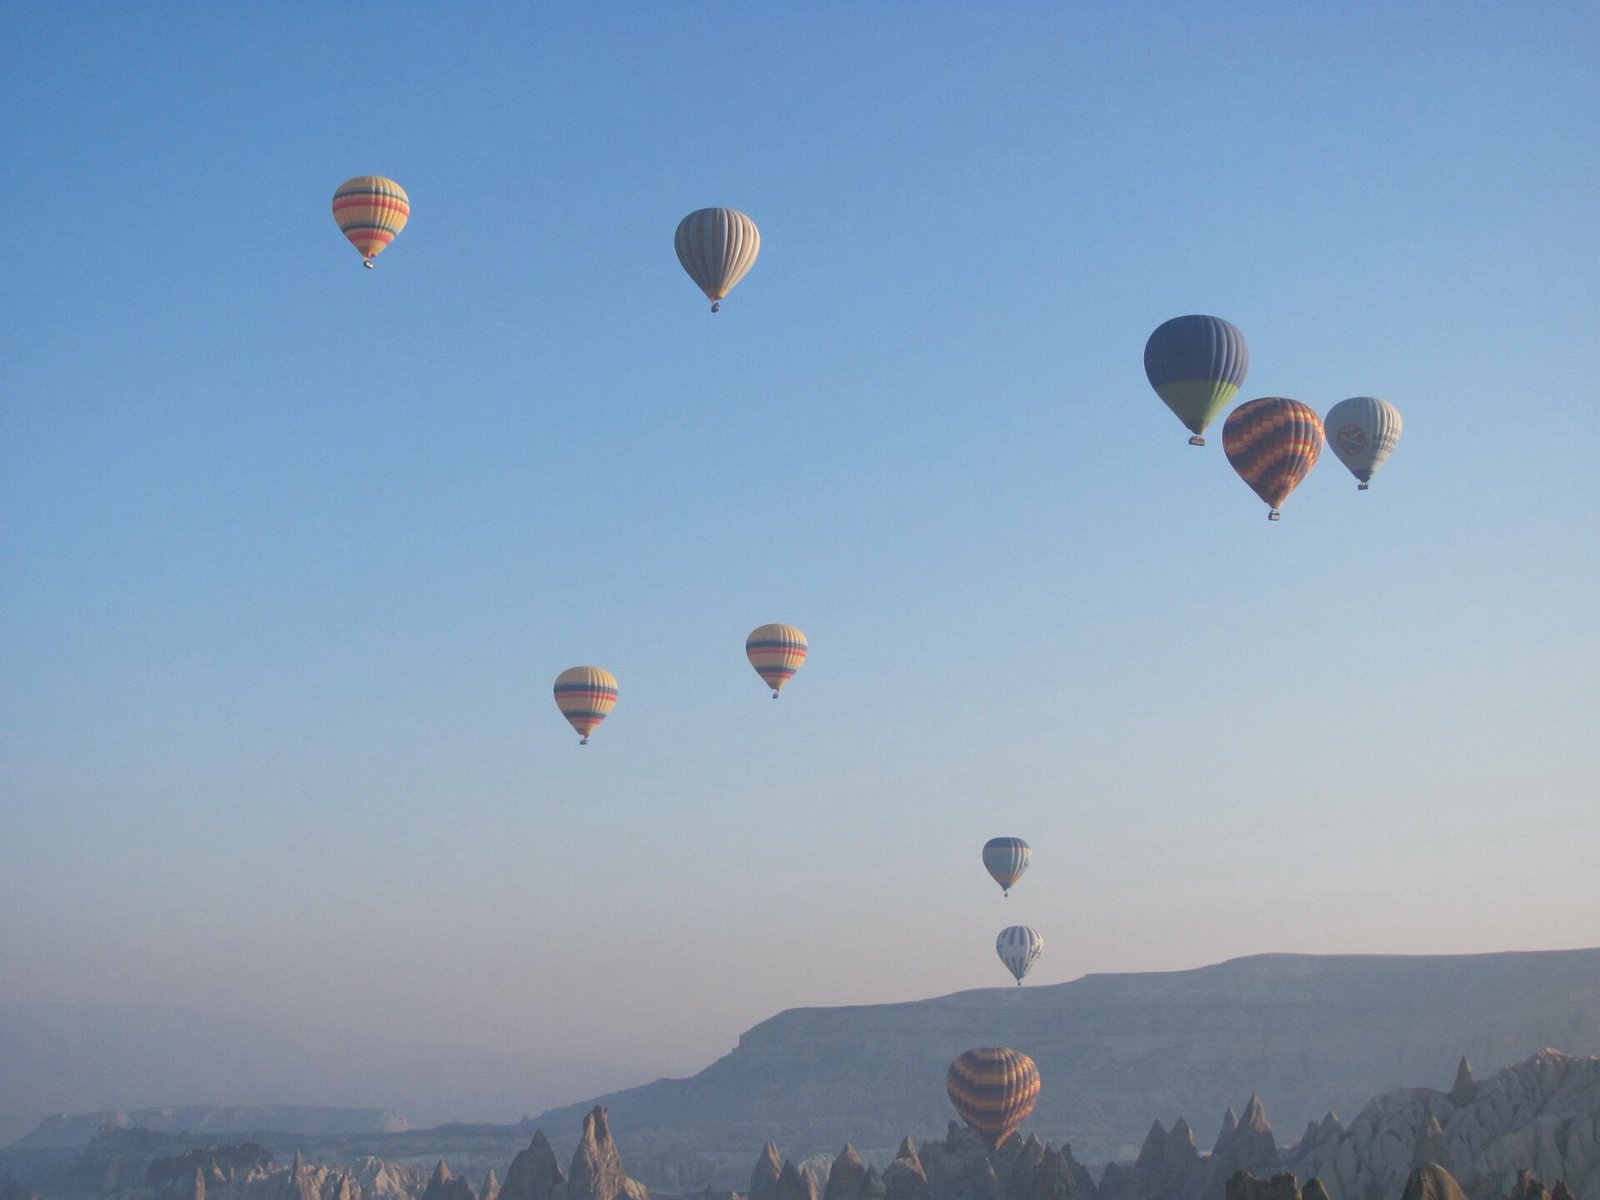
Cappadocia’s balloons fly on roughly six mornings in ten, not nine. Per the Area Directorate’s own record, the whole field flew on 64.5% of days in 2024 (236 of 366), 61.1% in 2025 (223 of 365) and 49.7% in the first half of 2026 (90 of 181). Operators publish their own cancellation rates; this is the number that decides whether anyone flies at all.
Verified against the Area Directorate record, August 2026.
Almost every article about Cappadocia repeats some version of the same reassurance: flights are cancelled maybe ten or twenty percent of the time, mostly in winter, so book a morning and you will probably be fine.
The Cappadocia Area Directorate publishes the actual figures. They are considerably worse than that, and the trend is going the wrong way.
What is in this guide
This page exists because we could not find these numbers presented anywhere in English. If you are planning a trip, the practical conclusion is at the bottom. If you are a journalist or a researcher, the tables are the point.
Last updated: August 2026
Editor’s note
We publish the denominator. Operators report their own cancellations; the Area Directorate reports how many mornings the whole field actually flew. The second number is the one that decides whether you get in a basket, and it is the one nobody puts in a guide.
The headline numbers
| Period | Days flown | Total days | Share |
|---|---|---|---|
| 2024, full year | 236 | 366 | 64.5% |
| 2025, full year | 223 | 365 | 61.1% |
| 2026, first half | 90 | 181 | 49.7% |
In the first six months of 2026, hot air balloons flew on fewer than half of all mornings.
That is not a winter effect. It is a whole-period figure covering January to June, and it is roughly fifteen percentage points below the 2024 full-year rate.
Month by month, 2026
| Month | Days flown | Share |
|---|---|---|
| January | 9 / 31 | 29% |
| February | 8 / 28 | 29% |
| March | 13 / 31 | 42% |
| April | 18 / 30 | 60% |
| May | 17 / 31 | 55% |
| June | 25 / 30 | 83% |
Look at May. It is the month most guides recommend, the month tour operators price highest, and the month with the largest gap between what visitors expect and what they get. Flights went up on 17 mornings out of 31.
Operator marketing for May tends to describe a cancellation rate around twenty percent. The official figure is closer to forty-five.
Why the gap between the marketing and the record
Three things, and none of them is anybody lying outright.
Operators quote seasonal averages, not monthly ones. A twenty percent annual cancellation rate was roughly true a decade ago. Quoting it in 2026 is stale rather than dishonest, but the effect on your planning is the same.
Cancellation is decided centrally and applies to everyone. The go or no-go call is made once each morning by the civil aviation authority for the whole field. No operator, at any price point, flies when the call is no. This is worth internalising: paying more does not buy you better odds.
Nobody publishes the denominator. Operators report their own cancellations. The Area Directorate reports days flown across the field. The second number is the one that matters to a visitor and it is the one nobody puts in a guide.
What this means for planning
The arithmetic is simple and it changes the shape of a trip.
| Mornings available | Chance of flying in May (55% daily) |
|---|---|
| 1 | 55% |
| 2 | 80% |
| 3 | 91% |
| 4 | 96% |
This assumes days are independent, which they are not — weather systems cluster, so consecutive mornings are correlated and the real numbers are somewhat worse than the table. But the direction is right and the practical rule falls straight out of it:
Stay three nights, and book the balloon for the first morning. Booking it for your last morning means a single attempt with no fallback. Booking it first gives you two more chances at no extra cost, because operators rebook cancelled flights onto the next flyable morning as a matter of course.
If you only have two nights, book the first morning and accept that you are taking roughly a four-in-five chance rather than a nine-in-ten.
The winter question
January and February both flew 29% of mornings. That is bad, and it is also the cheapest and emptiest time of year in Cappadocia.
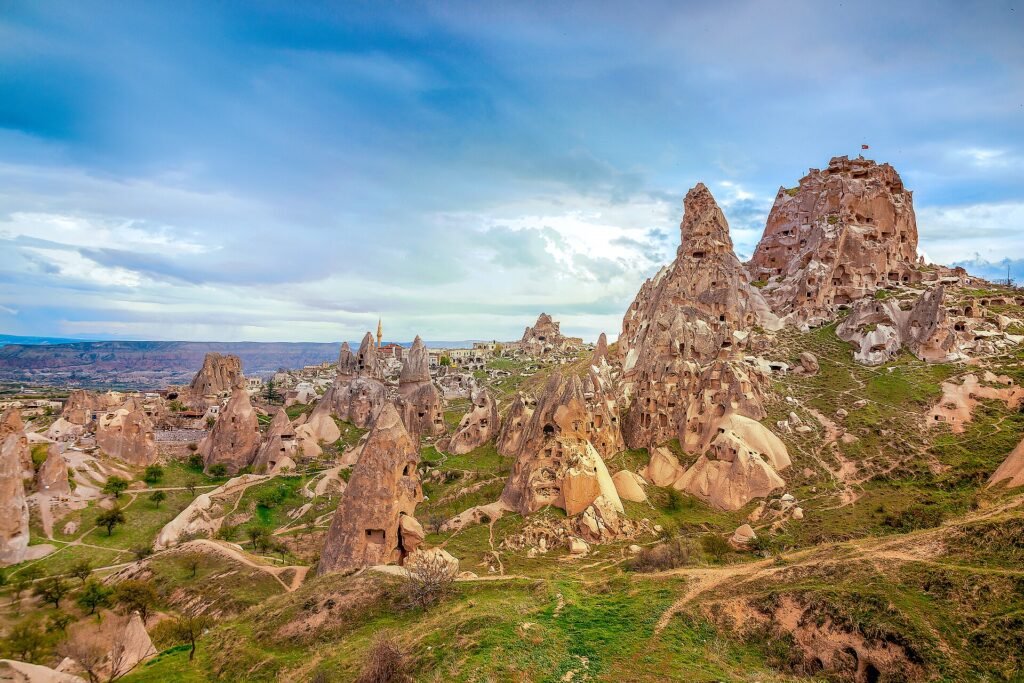
We would not plan a trip around the balloon in midwinter. We would plan a trip around the valleys, the underground cities and the cave hotels, and treat a flight as a bonus if the weather gives you one.
Sources and method
Figures are from the Kapadokya Alan Başkanlığı (Cappadocia Area Directorate), the public body that administers the region, as reported in Turkish media. The 2026 figures cover 1 January to 30 June.
We have not been able to obtain the Directorate’s own published dataset directly, and we would like to — if you know where it is posted, tell us and we will link it here.
What we are not claiming: we have not verified the daily records ourselves, and we cannot tell you what any individual operator’s cancellation rate is. The figure is days on which flights took place across the field, which is the number that determines whether you fly.
The wider context: the water and the crowds
Two other official records are worth putting next to the flight data, because they describe the same region under the same pressure.
Water. Source flow at Pamukkale, the other great natural attraction in the region, has fallen from 450 litres per second in 1993 to about 150 today, per figures cited by the Denizli hoteliers’ association from state hydraulic works measurements. The IUCN’s October 2025 World Heritage Outlook assessment records that there is no water management plan for that site.
Crowds. Pamukkale’s assessed carrying capacity is 1.4 million visitors a year. Actual visitors have run at roughly 2.3 to 2.5 million. And yet foreign visitor numbers there fell 12.5 percent in the first five months of 2026, with organised-tour arrivals down 27.7 percent — while the all-time single-day record, 21,192 people, was set on 29 May 2026 during Kurban Bayramı.
Cappadocia and Pamukkale are both being loved unevenly: fewer foreign visitors, more concentrated domestic peaks, and a resource base under strain in both cases.
A note on how we report numbers
We publish the denominator wherever we can find it, and we say plainly when we cannot.
On this page: the flight-day counts are official and we are confident in them. The probability table is our own arithmetic from those counts, and it assumes independence between days, which overstates your odds somewhat. The operator marketing figures are our characterisation of what is commonly advertised, not a quotation from any specific company.
If any of this is wrong, we would rather hear it than keep it. There is a contact page.
If you are citing this
The underlying figures belong to the Kapadokya Alan Başkanlığı. We have assembled and converted them into shares and probabilities; the tables above are free to reproduce with a link back.
We update this page when new half-year figures are published.